
JobRunr Pro Dashboard
The backoffice to your code!
On this page
The JobRunr Pro dashboard offers a lot of improvements that save your engineering teams a lot of time:
- Find any Job using the search functionality
- Save time thanks to usability improvements
- Use analytics to get an overview of your jobs
- Use custom views to save your prefills
- JobRunr Pro Enterprise Restrict access using Single Sign On authentication
- JobRunr Pro Enterprise Embed the dashboard within Spring Server
- JobRunr Pro Enterprise GDPR compliant Dashboard
Find any Job using the search functionality
Are you processing millions of jobs? Do you need to find that one job and find out if it succeeded? JobRunr Pro has you covered - thanks to Job Search feature, available to the Pro Dashboard users.
You can combine multiple filters to quickly find any job you are looking for using:
- Job Name
- Job Signature / Method Signature
- Last Exception thrown by the Job
- Job Fingerprint / Complete method with serialized parameters (toString())
- Any label the Job was given
- The queue the Job was submitted on
- The server tag of the Job
- The recurring job id
- Created after / Created before
- Updated after / Updated before
- …
To see a complete demo of JobRunr Pro with job filtering, have a look at this blog post.
This feature works great in combination with the custom delete policies. As you keep less data in your storage provider (either SQL or NoSQL), job filtering will be faster if there is less data.
Save time thanks to some usability improvements
The JobRunr Pro dashboard also includes some usability improvements that save you a lot of time. Just requeue all your failed jobs with one click.

Protection against destructive actions
The JobRunr Pro dashboard includes a confirmation dialog when attempting to execute a destructive action (e.g., deleting a job).

Use analytics to get an overview of your jobs
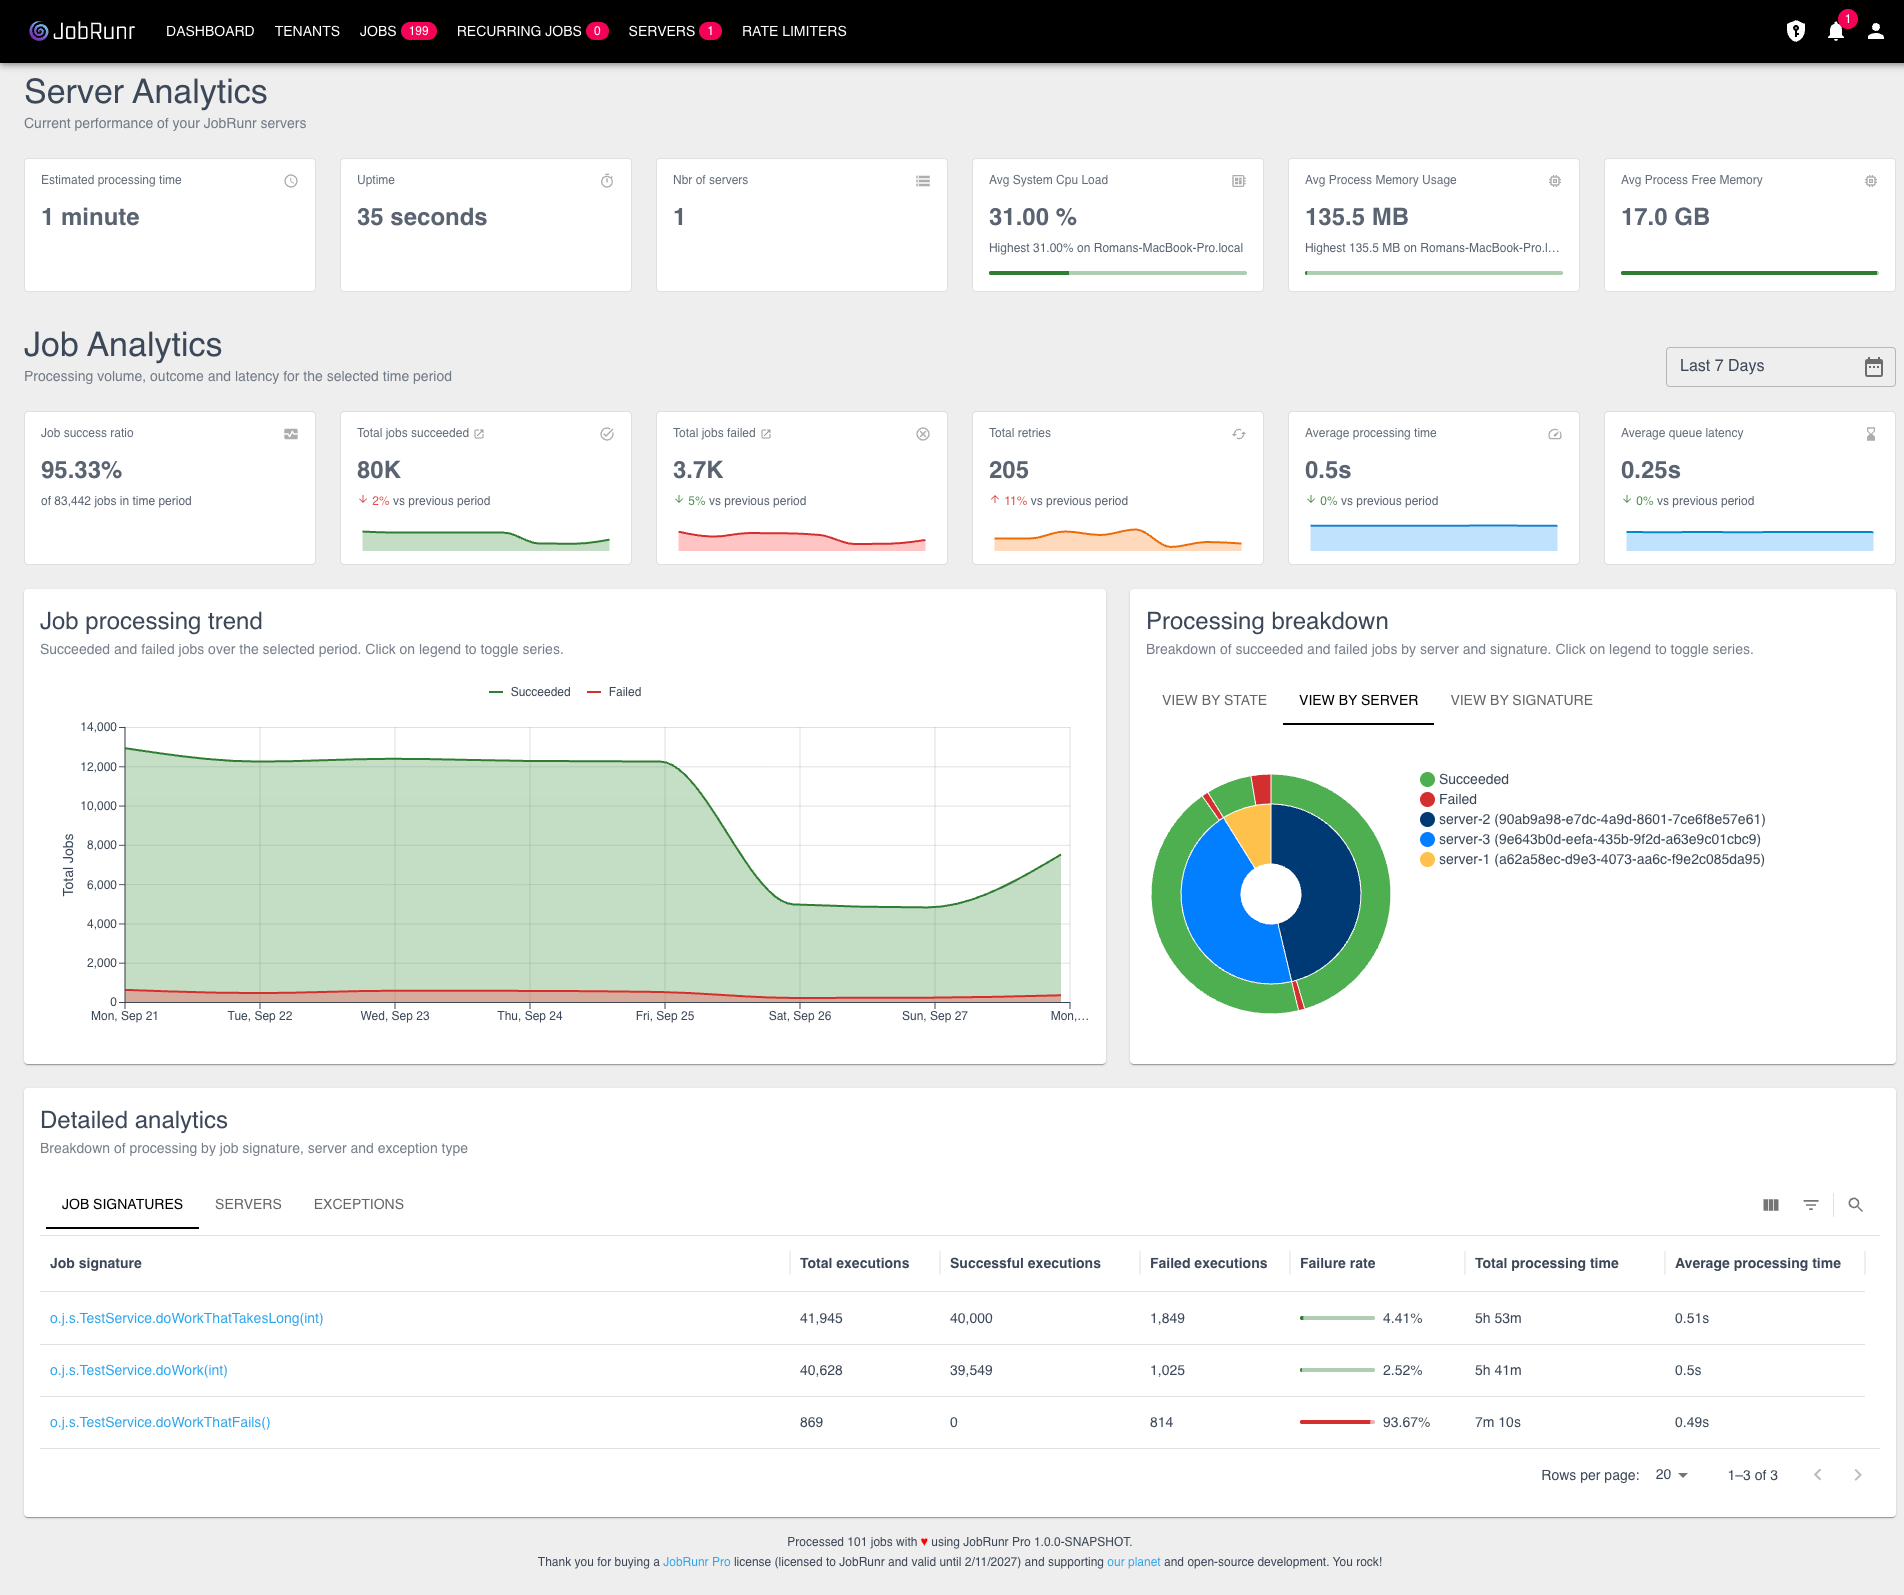
The JobRunr Pro dashboard gives you an overview of how your servers and jobs are performing. The Job Analytics show how many jobs succeeded, how many failed, how many retries have happened and more. This page also makes it easy to spot a server that’s failing more jobs than the rest, or one that isn’t picking up its share of the workload. The Job Analytics also help you to identify what exceptions are happening most often to be able to detect a pattern of failures.
You can select a signature from the table at the bottom of the page to get more details about what happened with that specific signature as well.
The time range is fully adjustable, so you can focus on the period that matters to you, be it yesterday or 2 weeks ago.
Use custom views to save your previous selections
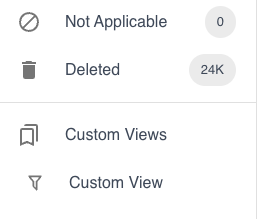
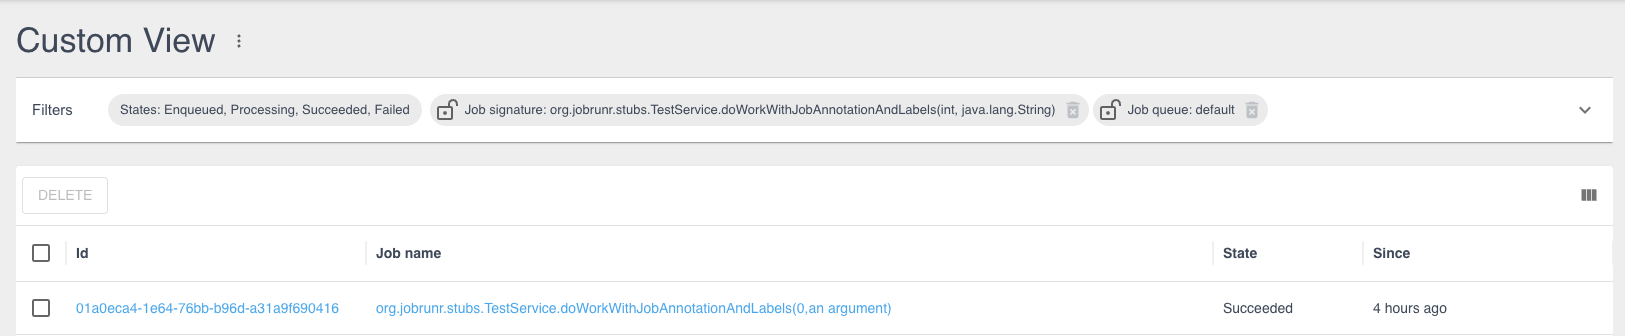
Thanks to custom views, you are able to save your currently applied job filters to be able to easily use them later, without having to manually copy the URL. When using custom views you can not only select any of the existing job filters to apply, but also opt to show multiple different states in the same view.
Meaning you could as an example select all jobs where the signature is org.jobrunr.TestService.doWork() and that are in either the Enqueued or Processing states.
Easier support to Proxy with a custom context-path
Are you running multiple instances of JobRunr inside your organization? Do you want to proxy them? Then a custom context path per JobRunr instance can make life easy. This can be enabled both using the fluent api or the application configuration of the JobRunr Spring Boot Starter, the Micronaut integration or the Quarkus Extension.
To configure it, use the following settings:
jobrunr.dashboard.context-path=/my-context-path
For Quarkus, you need to prefix this with quarkus..
Once configured, JobRunr will work with the context path configured by you - e.g. http://localhost:8000/my-context-path/dashboard.
Embed the dashboard within Spring Application Server JobRunr Pro Enterprise
Using JobRunr Pro Enterprise, you can also embed the dashboard within your existing Spring Application. This means that the JobRunr dashboard will be hosted by Spring and you can add your own authentication and authorization using Spring Security.
To configure it, use the following settings:
jobrunr.dashboard.type=embedded
For Quarkus, you need to prefix this with quarkus..
GDPR and HIPAA compliant dashboard JobRunr Pro Enterprise
Is your company operating in the medical or financial world and is your dashboard showing sensitive information? Do you still want your developers to quickly resolve any bugs and provide great support?
Thanks to the GDPR / HIPAA feature, any sensitive information will not be accessible in the dashboard anymore while still providing enough information to resolve bugs and provide support in case of unexpected exceptions.